White Papers · Middle of the House

Proof, on paper.

Four anonymized district case studies show what changes when school nutrition finally knows its numbers: one real-time P&L, every invoice checked against the bid, negative balances under control, and a KPI scorecard for every site.

The white papers

Four districts. Four problems solved.

Each paper follows one district from the problem it had to the result it measured in the FIG Middle of the House (Finance). District names and vendors are withheld; the work is real. Open any paper in your browser, or download the PDF to share with your business office and board.

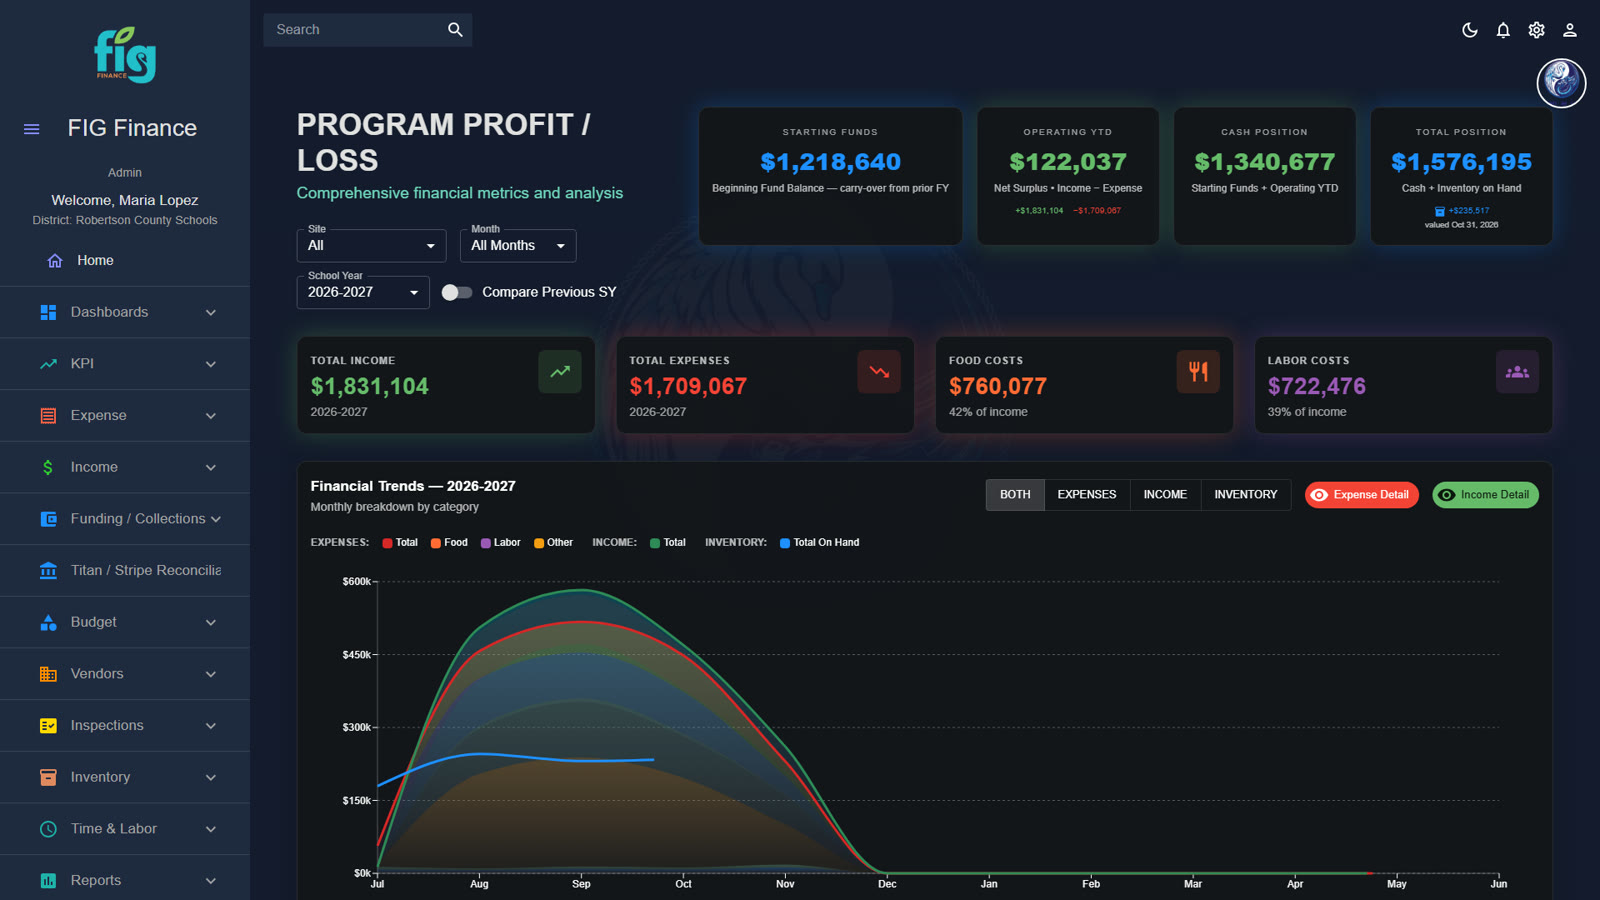
FIG Program Profit/Loss dashboard showing real-time income and expensePDF · White paper 01

Florida districtReal-time P&L

The Complete Finance System

A Florida K12 district (~15 schools) brought labor, point-of-sale and invoice scanning into one real-time P&L in the Middle of the House — five systems became one.

What was measuredIncome and expense by site and month, available now instead of weeks after close.
View
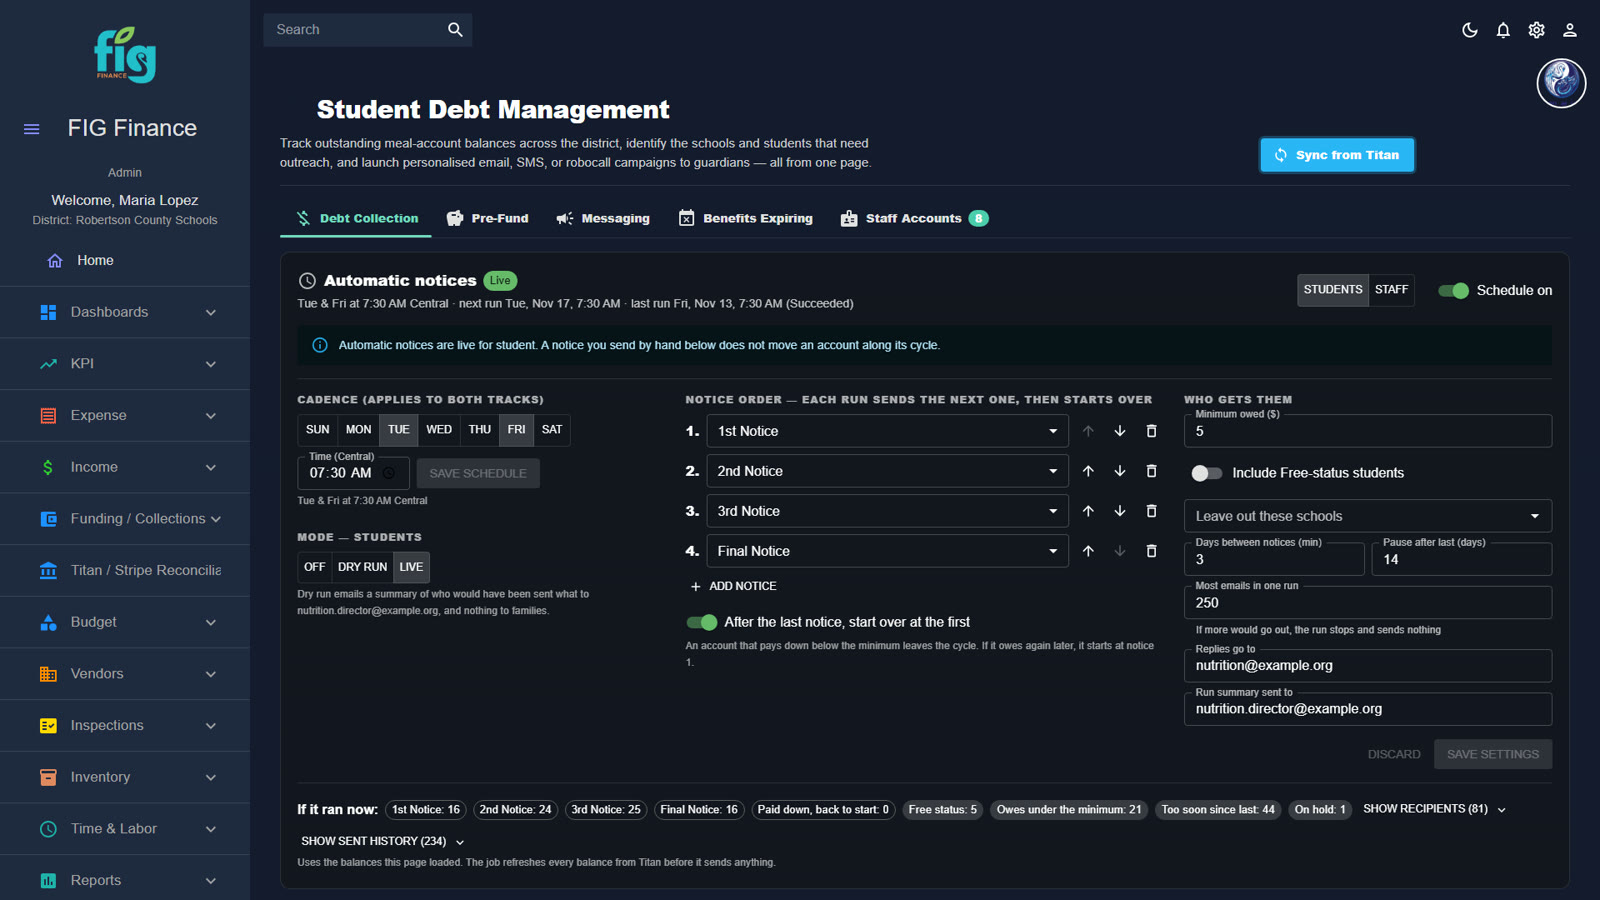
FIG negative balance management screen with automatic family noticesPDF · White paper 02

Tennessee districtNegative balances

Negative Balance Management

A Tennessee district (~20 schools) cut meal debt by removing payment friction — instant phone payment with no portal login, plus an integrated Angel Fund for community donations.

What was measuredStudent balances tracked over time, with automatic notices to families.

View
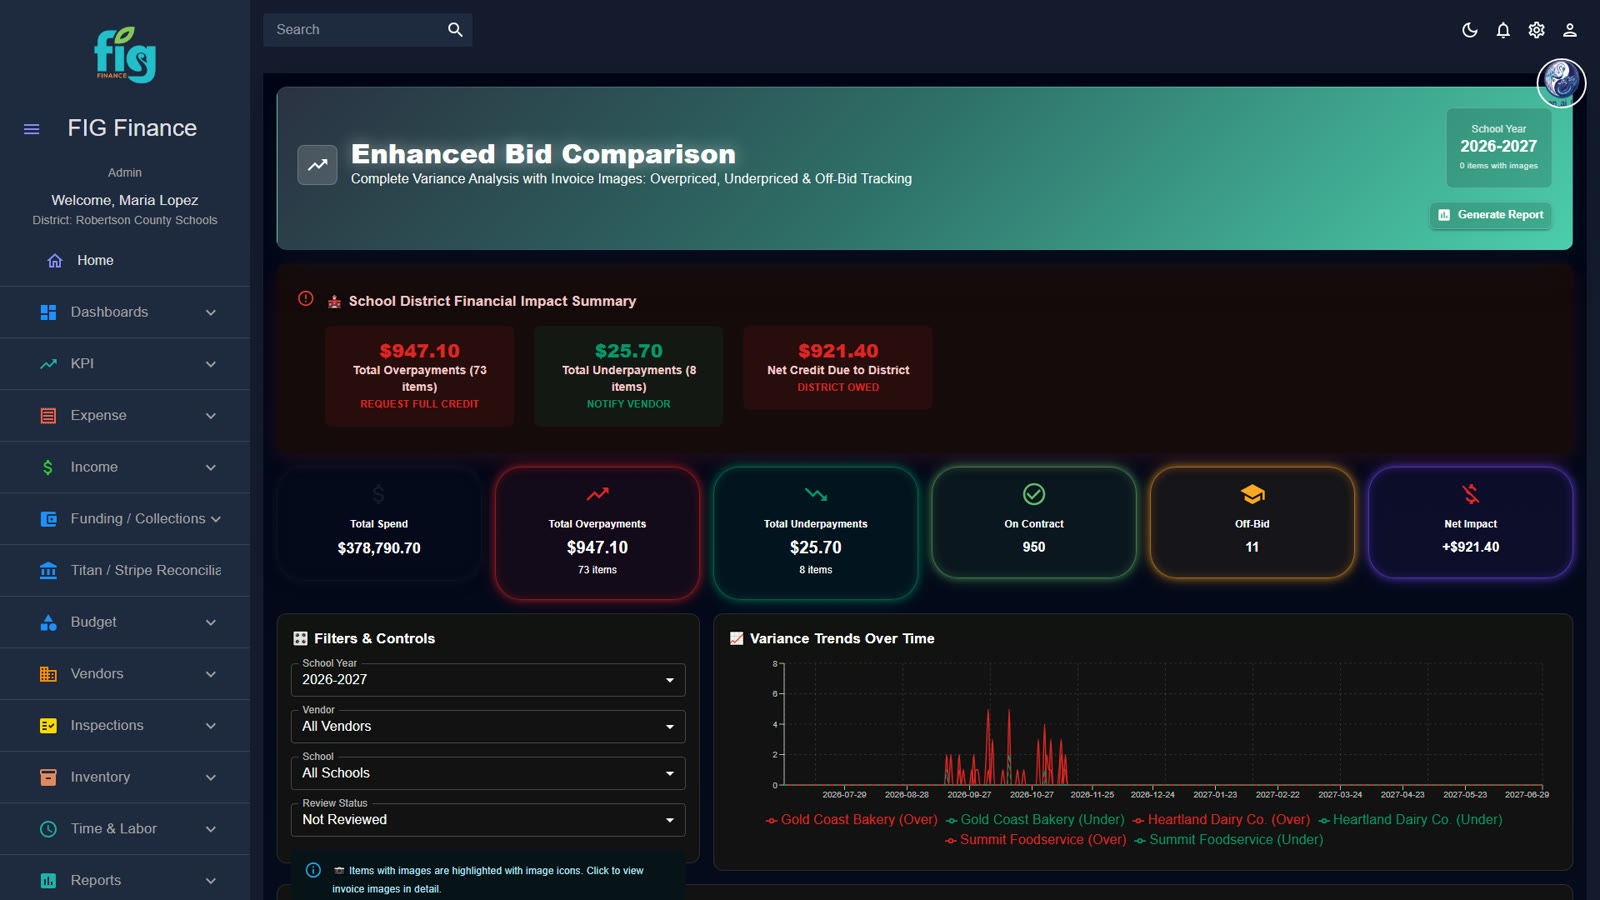
FIG invoice review screen comparing invoice prices to awarded bid pricesPDF · White paper 03

South Carolina districtInvoice review vs bid

Invoice Review & Bid Management

A South Carolina district (~18 schools) checks every invoice line against awarded bid pricing in the Middle of the House, turning each variance into a credit request to enforce vendor contracts.

What was measuredEvery invoice line compared to the awarded bid price, with credit requests attached.

View
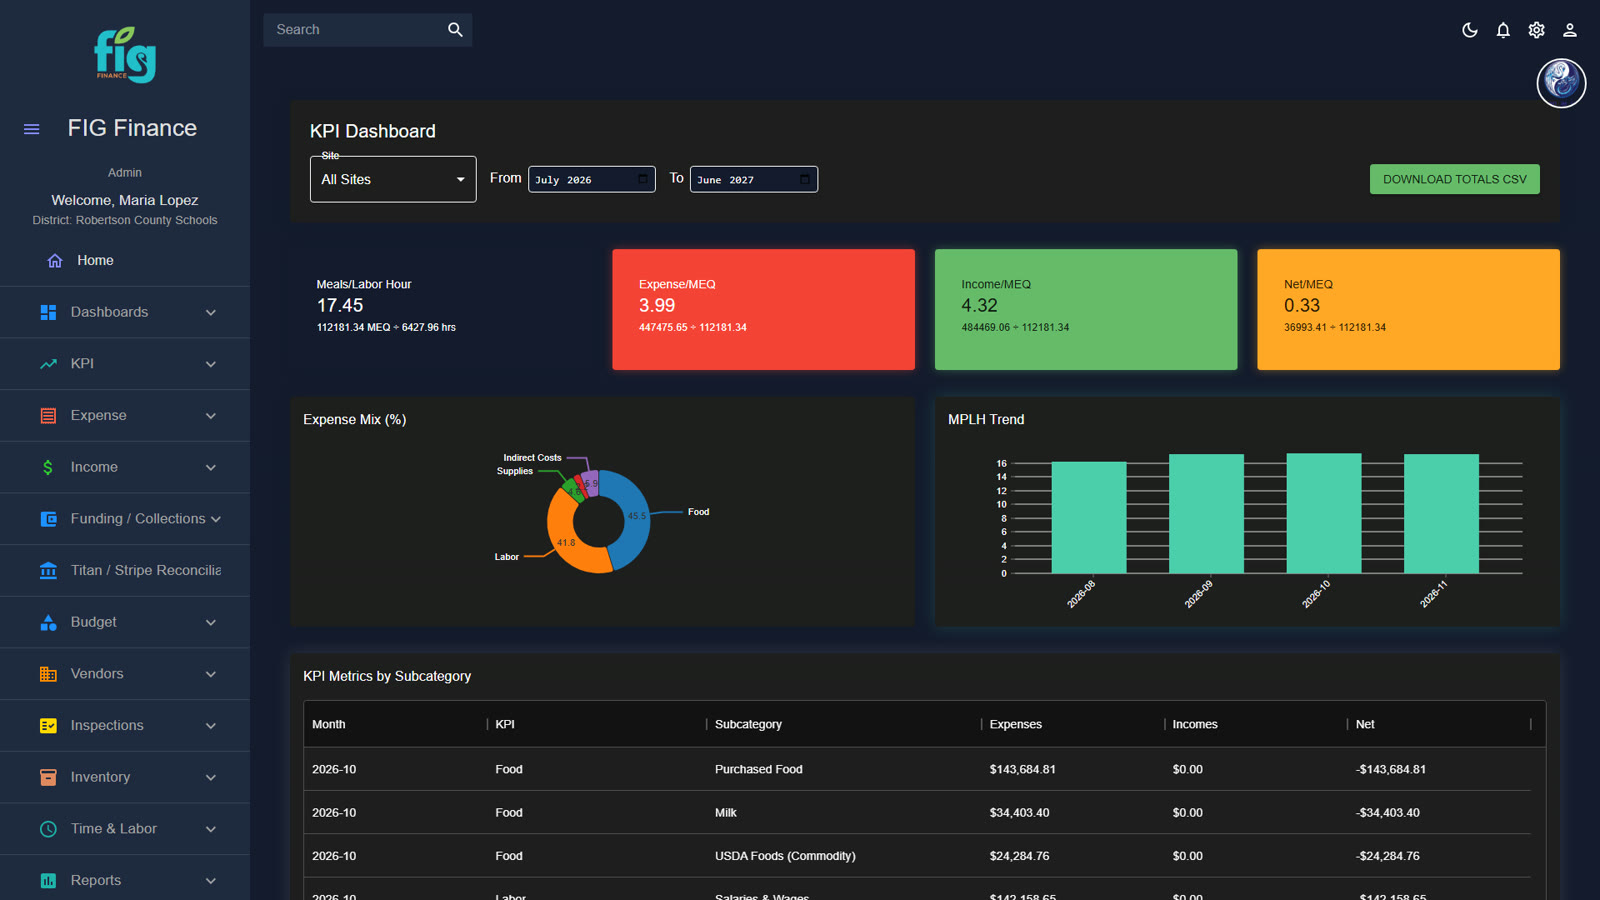
FIG KPI dashboard with meals per labor hour and per-MEQ economics by sitePDF · White paper 04

Florida districtKPIs for every aspect

Complete KPI Management

A 65-school Florida district replaced a legacy system and spreadsheets with the Middle of the House — real-time KPIs, MPLH, per-MEQ economics, and automatic monthly site report cards.

What was measuredMeals per labor hour, income and expense per MEQ, and a monthly report card for every site.

View

How results are measured

Measured in the district's own numbers.

The FIG Middle of the House (Finance) does not estimate outcomes from a model. It connects the systems a district already runs and measures change in the records those systems produce, so every result traces back to a source document.

Real-time P&L

Income vs expense, by site and month

Meal counts, reimbursement, labor and purchasing land in one P&L as they happen, so a director knows the numbers now, not weeks after the month closes.

Invoice review vs bid

Every line against the awarded bid

Each invoice line is compared to the price the district awarded. Variances become credit requests, with the invoice image attached as evidence.

Negative balances

Balances tracked over time

Student balances are followed from week to week, with automatic notices to families and a clear record of what was collected and how.

KPIs for every aspect

The industry's own yardsticks

Meals per labor hour, income and expense per meal equivalent, and participation, scored site by site so managers see where they stand every month.

Connect, don't replace

Same systems, before and after

FIG connects the POS, purchasing, back-of-house and labor systems already in place, through an API or document intelligence, so results come from the data those systems already produce.

Audit preparedness

A reconcilable trail

Every figure links back to the invoice, timecard or meal count behind it, so business offices and auditors can follow the work line by line.

See it for yourself

The screens behind the papers.

The modules the white papers describe, shown in the real FIG Middle of the House (Finance) software with demo data.

Real-time P&L

Know your numbers now

Not weeks after the month closes. Program profit and loss by site and month, built from the meal counts, labor and invoices that already flow through the district's systems.

  • Income and expense side by side, by site
  • Meal counts and the reimbursement they earn
  • A reconcilable trail back to source documents
FIG Program Profit/Loss dashboard with income and expense by month

Program Profit/Loss: the starting point of white paper 01.

Real FIG screen · demo data

Invoice review vs bid

Check every line against your bid

Distributors can keep separate price lists for each site. FIG compares every invoice line to the awarded bid price and turns each overcharge into a credit request.

  • Line-level comparison to awarded bid pricing
  • Credit requests with the invoice image attached
  • A record to bring to your next vendor conversation
FIG invoice review comparing invoiced prices to awarded bid prices with overcharge credits

Invoice review vs bid prices: the subject of white paper 03.

Real FIG screen · demo data

Negative balances

Balances that stop growing

Student balances are tracked over time, families get automatic notices, and every payment and Angel Fund donation lands in the same real-time view.

  • Balances followed week to week, by student and site
  • Automatic notices to families
  • Payments and community donations reconciled in one place
FIG negative balance management screen with balances by student and automatic family notices

Negative balance management: the subject of white paper 02.

Real FIG screen · demo data

KPIs for every aspect

A scorecard for every site

Meals per labor hour and per-MEQ economics, calculated automatically and delivered as a monthly site report card instead of a spreadsheet someone has to build.

FIG KPI dashboard showing meals per labor hour and per-MEQ figures by site

KPI dashboard: the heart of white paper 04.

Real FIG screen · demo data

Questions directors ask

Before you read, the short answers.

Would we have to replace our systems?

No. FIG connects the POS, purchasing, back-of-house and labor/payroll systems you already run and brings the data together. There is no requirement to change what you run; the Middle of the House sits between your systems and makes them more valuable.

Will the numbers match our books?

FIG keeps a reconcilable trail back to the source invoices and documents, so your business office can tie out line by line rather than take a single total on faith.

Why are the districts anonymous?

We do not publish customer names. Each paper keeps the district's size, location and results, and withholds anything that identifies the district or its vendors.

Does this work beyond a single district?

Yes. Portfolio management is built to accommodate food service management companies running portfolios across many districts (one account, many districts), and it is ready for state-level reporting and oversight.

Are we on our own after we sign?

No. FIG is software and a service: training and implementation support, with weekly implementation meetings while your systems are connected and your team gets comfortable.

How do we buy it?

As the first Middle of the House built for K12 nutrition, FIG can often be purchased as a sole source, or through your RFP process. We'll help with the paperwork.

Software and a service

Find what works, fix what doesn't, connect the systems.

Consistency starts with training. FIG Learning Management builds the team; the Middle of the House measures the results.

Your district or portfolio, next

See your own numbers.

Tell us which paper sounds like your district or portfolio. We'll walk you through the FIG Middle of the House (Finance) with your systems in mind.